Stop Tagging Ads as Good: Build a Creative Research Taxonomy You Can Actually Use
“Strong hook” and “premium” are verdicts, not tags. Build a small taxonomy of observed and inferred facets so your team can count, filter and compare ads next quarter.
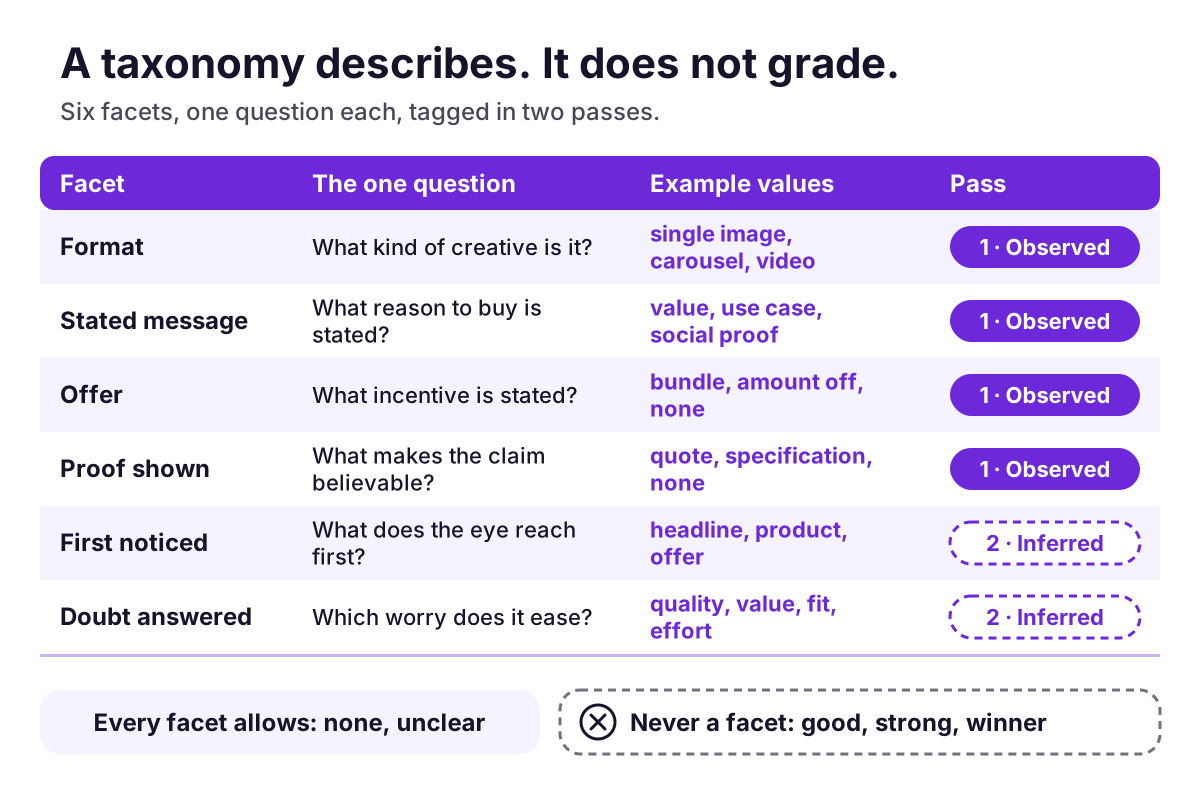
Ask three people on your team to tag the same ad and you might get “strong hook”, “premium” and “scroll-stopper”. Three tags, no agreement on what any of them means, and nothing you could count, filter or compare next quarter. The folder is tagged, technically. It is just not searchable in any way that helps a decision.
A research taxonomy fixes that by replacing verdicts with descriptions. This guide shows how to build a small one in an afternoon for the Meta ads you study: the rules every tag must follow, a starter set of facets, a two-pass tagging routine, a worked example with three invented ads, and the maintenance habits that keep it honest.
Why “good” is not a tag
- It grades instead of describing. Good for whom, at what, by which measure? Nothing visible in the ad answers that.
- It cannot be wrong. Nobody can be shown mistaken about “engaging”, and a tag nobody can disagree with is a tag nobody can learn from.
- It cannot be counted. “Strong hook: 14 ads” measures your team’s taste, not the ads.
- It smuggles in results. Calling an ad “strong” or “winning” quietly claims a performance that public ad records do not show.
Five rules for a research tag
- Describe, don’t grade. A tag says what is there, never how good it is.
- One question per facet. A facet is a group of tags that answers a single question, such as “What incentive is stated?”
- No overlap inside a facet. Either the values exclude each other or you declare the facet multi-select.
- Always allow “none” and “unclear”. Absence is information. A blank cell is not.
- Label every tag observed or inferred. Observed means you can point to the words or pixels that justify it. Inferred means it is your reading. Observed does not mean objective. It means checkable.
Spot the verdict in disguise
Some tags look descriptive and are not. “Clean”, “bold”, “premium”, “clear”, “engaging” and “effective” all grade the ad while pretending to describe it. A quick test: would the tag make sense in a performance review of the ad? If so, it is a verdict. Replace it with something you could point at. “One product on a plain background, headline in the upper third” says more than “clean”, and two people can check it.
A starter taxonomy
Six facets are enough to begin. The first four are observed; the last two are inferred.
- Format: single image, carousel, video, other.
- Stated message: product detail, use case or occasion, outcome, value, social proof, comparison, brand story, none or unclear.
- Offer (multi-select): none, amount or percentage off, bundle, free delivery, gift with purchase, subscription, first order, limited time, unclear terms.
- Proof shown (multi-select): none, customer quote, rating or review count, specification or number, demonstration, third-party mention, return or warranty terms.
- First noticed (inferred): headline, product, person, offer, proof.
- Doubt answered (inferred): quality, value, fit, effort, trust, none apparent. The creative angle research page works from a similar list of doubts.
Notice what is missing: any facet called “good”, “strong” or “winner”. That absence is deliberate.
Tag in two passes
Pass one: observed facets. Read the words, look at the image, and tag only what you can point at. Finish the whole batch before starting pass two.
Pass two: inferred facets. For each tag, write one line of evidence, such as “Doubt answered: fit. Headline says ‘built for wet rocks’.” If you cannot write the evidence line, the tag is “unclear”.
Splitting the passes keeps theories from leaking into facts. Once you have decided an ad is “about quality”, you will start seeing quality cues that were never stated.
Set up the sheet
A spreadsheet is plenty. One row per record, with the scope columns first so that no tag ever travels without its context:
Record | Page | Market | Looked on | Format | Message | Offer | Proof
Notes | First noticed (I) | Doubt answered (I) | Evidence line
Use drop-down lists for every facet so a typo cannot quietly create a new tag, and keep “none” and “unclear” in every list. The notes column is the only free-text field. It is also the raw material for the next version of the taxonomy.
A worked example: three invented ads
Illustrative example: Demo Trail is a fictional trail-shoe brand. The three ads below are invented for this article.
- Ad 1: a close-up of a shoe outsole on wet rock. Headline “Built for wet rocks.” Small line: “Grip tested on five surfaces.” Button: Shop now.
- Ad 2: two shoes side by side. Headline “Two pairs, one price.” Badge: “Save 25%.”
- Ad 3: a quote card. Headline “Why runners are switching.” Quote: “Best trail shoe I’ve owned.”
A busy team might have tagged these strong hook, premium (Ad 1), good offer, clean (Ad 2) and engaging, social proof (Ad 3). Here is the same set, tagged by facet:
Ad 1  Format: single image | Message: product detail
      Offer: none | Proof: specification claim, source not shown
      First noticed (I): product | Doubt answered (I): fit
Ad 2  Format: single image | Message: value
      Offer: bundle, amount off, unclear terms | Proof: none
      First noticed (I): offer | Doubt answered (I): value
Ad 3  Format: single image | Message: social proof
      Offer: none | Proof: customer quote, attribution not checkable
      First noticed (I): headline | Doubt answered (I): quality
Now you can filter. “Show me every ad with a bundle and no proof” is a question the second set can answer and the first cannot. With three ads that is trivia. With sixty ads from five Pages it becomes a question worth pursuing, always within the limits of that sample.
Report tallies with their denominators
Tags exist to be counted, and counts are where careful tagging often goes wrong. Always give the denominator. Report the share of “unclear” beside every facet, because an ad that leaves out its terms is itself an observation. And do not compare Pages unless the samples are comparable.
Illustrative numbers, invented for this article. Weak: “Page A leads with bundles.” Better: “Bundles appear in 12 of 31 static records collected from Page A in one market, looked at on a stated date. In 5 of those 12 the terms are not shown.” The second version can be checked, can be repeated next month, and does not pretend to know why Page A does it. If the 12 turn out to be variants of two ideas, the number of ideas is two, so say that as well.
Write dictionary entries, not just lists
A list of tags invites quiet disagreement. A dictionary entry settles it in advance:
TAG:         Offer / Bundle
Type:        Observed
Definition:  More than one unit or item shown for a stated price
             or saving.
Counts:      "2 for 1", "Buy 3, save 25%", "The complete set"
Does not:    A single product shown beside an unrelated accessory.
Edge rule:   Set shown but no price or saving stated: tag Message:
             product detail and Offer: none.
The “Does not” line and the edge rule earn their space. Most tagging arguments are about near-misses, and those two lines record the ruling.
Check that two people agree
Pick ten ads. Two people run pass one independently. Lay the results side by side and mark every disagreement. Do not debate who is right. Ask which sentence in the dictionary would have prevented the disagreement, and edit that sentence. Then retag the ten. A facet that still produces disagreement after two edits is probably asking two questions at once, so split it.
Keep it alive
- Version it. Label the dictionary (v1.0, with a date) and log every change. If you split a tag, old and new counts stop being comparable, and a trend line may show your rule change rather than a market change.
- Mine the notes. Keep a free-text notes field. When the same note keeps appearing, promote it to a tag.
- Prune. Merge near-duplicates and retire tags nobody has used for a couple of review cycles.
- Stay small. If your team cannot remember the facets, they will not use them.
Using AI help without losing the thread
Give an AI assistant your dictionary word for word and ask it to return, for each ad, the tag, an observed-or-inferred label and the quoted words or described pixels that support it. Spot-check a sample against your own tagging. Treat automated labels like any inferred tag: useful for sorting, poor at settling arguments. Ad8’s coverage page says its own hook categories, visual styles and similarity groupings are AI-assisted labels that may be wrong, and that important decisions deserve record-level review. The same discipline applies to any tool, and to you. The AI research prompts include phrasing that asks for evidence before conclusions.
What a taxonomy will not tell you
It will not say which ads work. Counts describe the sample you tagged, not the market, and a value that never appears in your sample is a question, not a gap. Carry the scope with every number: which Pages, which markets, which dates, and which records were missing or incomplete. A tagged sample of public ads can organize your thinking and help you prioritize what to test. After that, your own results take over. And because tags describe how an ad is built, they are evidence for original work, not permission to reuse another advertiser’s images, copy or marks.
Sources and further reading
- Creative angle research: separating messages from formats and from the doubts an ad answers.
- Static ad intelligence: reading the structure of a static ad.
- AI research prompts: prompts that separate observation from interpretation.
- Data coverage and research limits: record data versus AI-assisted labels.
- Understanding your report: treating labels as interpretations.
- Sample report: a fictional report that labels what was observed and what was interpreted.
- Static ad brief template: where tagged findings turn into original briefs.
- Meta Ad Library: a public place to practice tagging, with the date and market noted on every sample.
The Demo Trail ads and the sample tallies are invented. The taxonomy is a starting point drawn from Ad8’s editorial practice, so adapt the facets to your own category and questions.
Turn the next observation into a better question.
See how a source-linked review separates what was observed, what it might mean, and what you could test with your own creative.
Explore the sample report