The Meta Ad Library Is Not a Swipe File: A Better Way to Research Competitors
A swipe file stores what looked good. Research starts with a question, a declared sample and notes that separate what you saw from what you suspect. Here is a five-move method.
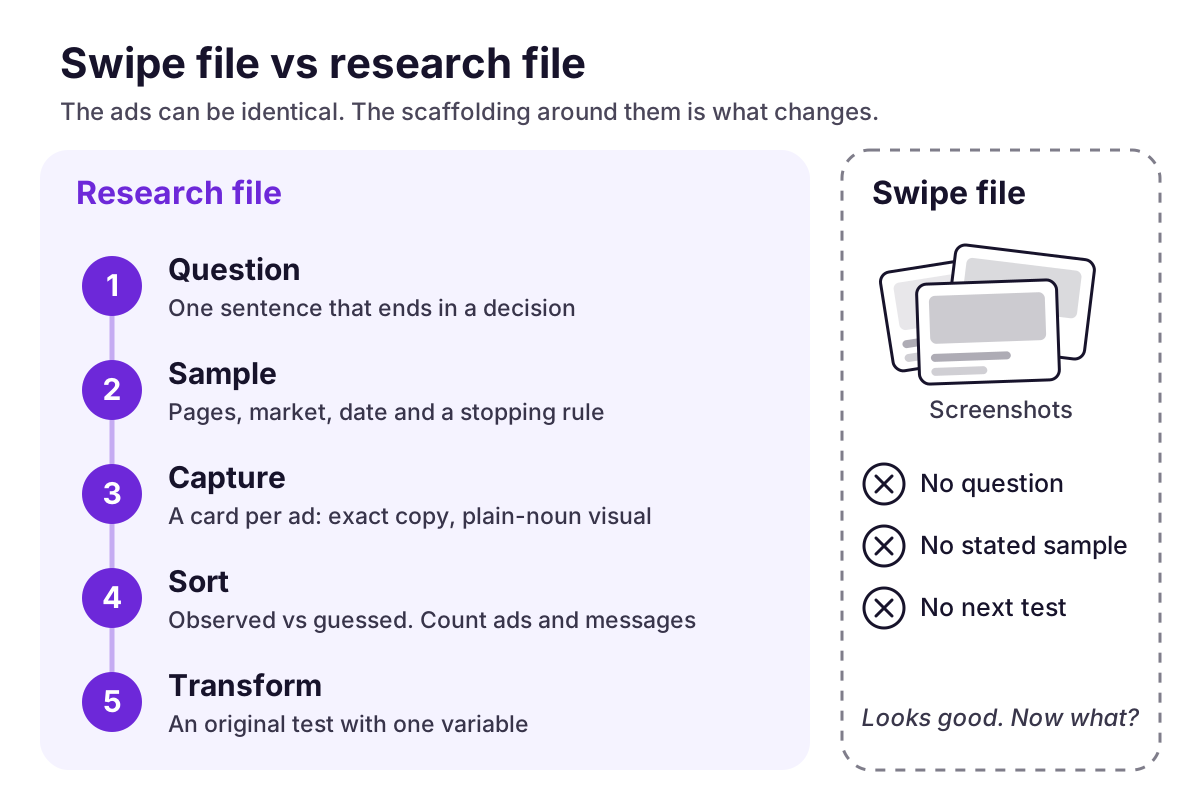
Most marketers have the folder. It might be called “Ad inspo”, “Competitor stuff” or just “Screenshots (214)”. It began as a sensible idea: look at what other brands run and learn from it. Then it quietly turned into a museum, with plenty of exhibits, no curator, and nobody able to answer the one question that matters on Monday morning: so what do we test next?
The Meta Ad Library makes browsing public ads easy, and that ease is the trap. Easy browsing produces swipe files. Research needs a different shape. This guide gives you a five-move method, a capture-card template and a worked example (invented for illustration) so that your next hour in the library ends with a decision instead of another folder.
Why the swipe file feels productive and isn’t
Saving an ad is rewarding in the moment. You found something clever, you filed it, the folder grew. Now look at what the folder cannot tell you:
- Which question it answers. If you saved ads because they looked good, the folder answers “what do I like?”, not “what should we say?”
- What is missing. You saved what you noticed, so the sample reflects your attention rather than the market.
- When and where you looked. Without a date, Page and market on each item, screenshots from different weeks blur into one picture.
- What you will do differently on Monday. Inspiration without a hypothesis is decoration.
A research file flips each of those. It has a stated question, a declared sample, notes that separate what you saw from what you suspect, and an output: a testable idea for your own creative. The ads are the same ads. The scaffolding is what changes.
What the Meta Ad Library is, and what it is not
Meta describes the Ad Library as a transparency hub where people can look up ads running across its technologies. Meta’s help page explains what it includes, and it is worth reading before you trust any absence: scope depends on things like ad type and region, and it can change. The search interface itself lives at facebook.com/ads/library.
Two habits keep you honest about it.
Treat it as a window, not an analytics report. It lets you see ads. It does not tell you which ones paid back, what the advertiser’s results were or why a creative was chosen. Conversion and return-on-ad-spend figures for a competitor are not something a public library hands you, so no amount of scrolling will produce them.
Treat every search as a snapshot. What you see depends on when you looked and what the library includes for that ad and region. “Nothing found” is a limited statement. It is not evidence that a brand has stopped advertising.
The five-move method
To keep this concrete, we will follow one example through all five moves. Illustrative example, invented for this article: Demo Candle is a small home-fragrance brand planning its next batch of static ads. It watches three competitor Pages: Demo Candle A (multipacks and price), Demo Candle B (design-led gifting) and Demo Candle C (ingredient transparency). None of this is real data.
Move 1: Write the question before you open a tab
A session with no question gets steered by whatever you see first. Write one sentence:
This week we need to understand ___ so we can decide ___.
Weak: “See what competitors are running.” Sharper: “Which reasons to buy do A, B and C lead with in their static ads, so we can pick the headline variable for our next test?” A good question can be answered with a table, not a mood board.
Move 2: Declare the sample
Before you scroll, write down:
- Pages, not brands. One brand can run several advertiser Pages: regional ones, sub-brands, similarly named lookalikes. Record the exact Page name and link.
- Market and date. Which market context did you search, and on what day?
- A stopping rule. “All visible static ads from each of the three Pages” is a rule. “Until I got bored” is not.
- Formats. Static only, or video too? Mixing them blurs comparisons.
Demo Candle’s sheet reads: three Pages, one market, static only, all visible ads, looked at on a stated date. Then you notice Page A shows 31 ads and Page C shows 6. That is not a finding about who is “louder”. It is a reason to count messages instead of ads, which is Move 4.
Move 3: Make capture cards, not screenshots
Keep the screenshot if you like, but attach it to a card. The card is what you will search, sort and argue over next month.
Record:          [library link or identifier, as displayed]
Page / market:   [exact Page name] / [market searched]
Looked on:       [date]    Start date shown: [as displayed, or none]
Format:          [static / video / carousel]
Exact copy:      "[headline]" / "[body line]" / [button text]
Visual:          [what is literally shown, no adjectives]
Offer stated:    [offer and conditions as written, or "not shown"]
Observation:     [one sentence, only what is visible]
Interpretation:  [one sentence, labeled as a guess]
Two rules make cards work. Describe the visual in plain nouns (“one candle on a shelf, price top left”) rather than verdicts (“premium, aspirational”). And keep observation and interpretation in separate fields, because every later team disagreement is easier to settle when they are.
Move 4: Sort what you saw from what you suspect, then count carefully
After filling in the cards, Demo Candle writes:
- Observed: of Page A’s 31 visible ads, 22 lead with a multipack price.
- Interpretation (a guess): Page A may be competing on value.
- Rival explanation: those 22 may be variants of two or three ideas, so “22” overstates how many distinct arguments the sample holds.
Count two things separately: ads (records) and messages (distinct reasons to buy). Page A: 31 ads, three messages. Page B: 11 ads, two messages (design detail, gifting). Page C: 6 ads, one message (what goes into the wax). Put the denominator next to every number you share.
Then treat absence as a question. If none of the three leads with burn time, that is worth investigating. It is not an uncontested opportunity: the sample may be small, the window short, or the library may not show everything you would like it to.
Move 5: Transform it into a test, not a lookalike
The product of research is a hypothesis for your own creative. For Demo Candle:
Customers may want to know how long the candle lasts, a question none of the sampled ads answers directly. Test: same product photo and layout; headline one leads with price per candle, headline two leads with burn time, using the figure from our own verified testing. We will judge the result with our own campaign data.
Name the variable, the proof you need and the measure you will use from your own results. Study how an idea is built, and never borrow another advertiser’s images, copy, logos or talent. The static ad brief template has eight fields that keep the direction original.
Five ways this goes wrong
- Presence mistaken for performance. An ad being visible tells you it is visible. Fix: write “observed”, never “winning”.
- Cherry-picking. Saving only the striking ads makes every competitor look brilliant. Fix: apply the stopping rule to all ads, the boring ones included.
- Merged Pages and markets. Fix: one card, one Page, one market.
- Variants counted as strategies. Fix: count messages as well as ads.
- Copying the surface. A near-clone teaches you little and creates avoidable rights problems. Fix: borrow the question an ad answers, not its look.
Before you call it research
Run through this list. If you cannot tick an item, say so in the notes rather than hiding it.
- The question is one sentence and names a decision.
- Every Page is identified exactly, with its market and the date you looked.
- You wrote the stopping rule before you scrolled.
- Each record has a card with exact copy and a plain-noun description.
- Observations and interpretations sit in separate fields.
- Numbers show their denominators, ads versus messages.
- At least one rival explanation is written down.
- The output is a test with one variable and a measure you control.
Where Ad8 fits
Meta’s library is the primary public source for what Meta shows. Ad8 is designed as a research layer on top of public ad records it has collected: it keeps advertiser Pages and markets separate, records when ads were first and last observed and when each check last ran, follows chosen Pages so you stop re-running the same searches (competitor tracking), and structures output as observation, interpretation and test hypothesis in a report (sample report). A connected AI assistant can query those records through MCP and cite what it used. What Ad8 does not do is show a competitor’s spend, ROAS or conversions: it works with public ad records, not anyone’s ad account. It is an independent product, not affiliated with or endorsed by Meta.
If you prefer to stay manual, the same method works with a spreadsheet and some discipline. The weekly competitor review template shows how to turn it into a recurring habit.
Sources and further reading
- About the Meta Ad Library (Meta Business Help Center): Meta’s own description of what the library includes. Check it for current scope.
- Meta Ad Library: the public search interface.
- Data coverage and research limits: how Ad8 labels coverage states and timestamps.
- Sample report: see how a finished write-up separates what was observed from what was inferred.
- Weekly competitor review template
- Static ad brief template
Demo Candle and its three competitors are invented to show the method. The five moves are Ad8’s editorial practice, not research findings, and no particular result follows from using them.
Turn the next observation into a better question.
See how a source-linked review separates what was observed, what it might mean, and what you could test with your own creative.
Explore the sample report